3D instability in a cylinder with a cold cover
Experimental setup
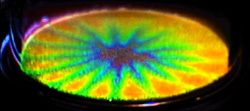
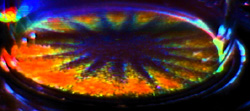
| Temperature distribution visualized by liquid crystals.
Color images are taken in the horizontal cross-section under the cold cover. Experiment by Prof. T.Kowalewski. |
| Isolines of the calculated 3D temperature perturbation plotted at the cross-section where above photos were taken. |